
RANSAC - RANdom Sampling And Consensus
19 Oct 2017 | mlRANSAC: RANdom Sampling And Consensus
뭐에 쓰는 물건인고?
- 목적
- 어떤 관측값들에 대해 모델의 파라미터를 추정하고싶다.
- 문제점
- 관측값에 노이즈가 끼어있다.
- 측정오차가 심해서 모델을 예측하는데 방해되는 관측값(outlier)이 존재한다.
예제를 중심으로 설명하기 위해 포물선에 대한 어떤 관측값들을 얻었고, 이를 통해 포물선 모델의 parameter를 정한다고 가정해보자.
데이터 만들기
여기서는 오차가 심하지 않은 데이터(1)와 심한 데이터(2)를 만들어본다.
import numpy as np
import matplotlib
import matplotlib.pyplot as plt

a_true = -1
b_true = 8
c_true = 1
num_samples = 100

def good_data(sigma=1, num_samples=100):
    x = np.linspace(0.0, 10.0, num_samples)
    y = a_true*x*x + b_true*x + c_true \
        + np.random.normal(0, sigma, num_samples)
    return x, y

def bad_data(sigma=1, num_samples=100):
    x = np.linspace(0.0, 10.0, num_samples)
    # noise 생성!
    noise = np.zeros(num_samples)
    x_left_idx = x > 4
    x_right_idx = x < 6
    x_idx = x_left_idx & x_right_idx
    noise[x_idx] = -10

    y = a_true*x*x + b_true*x + c_true \
        + np.random.normal(0, sigma, num_samples) + noise
    return x, y

x_good, y_good = good_data(num_samples=num_samples)
x_bad, y_bad = bad_data(num_samples=num_samples)

plt.figure(1, figsize=(8, 3))
plt.subplot(121)

plt.scatter(x_good, y_good)
plt.title('good_data')
plt.xlabel('x')
plt.ylabel('y')

plt.subplot(122)
plt.scatter(x_bad, y_bad)
plt.title('bad_data')
plt.annotate('noise',  # noise 낀 곳을 표시
             fontsize=20,
             xy=(4, y_bad[int(num_samples/10)*4]),
             xytext=(8, 2),
             arrowprops=dict(facecolor='red', shrink=0.05))
plt.show()
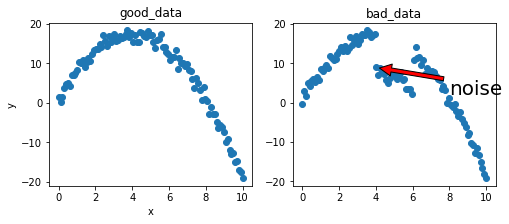
위의 두 sample을 가지고 실험해보자!
residual 최소화
가장 쉬운 예제로 $\sum residual^2$을 최소화하도록 포물선을 근사시켜보자.
여기서는
np.polyfit이라는 함수를 써서 진행한다. Appendix에서 직접 만들어보자…
def get_y(x, a, b, c):
    return a*x*x + b*x + c

a1, b1, c1 = np.polyfit(x_good, y_good, 2) # coefficient를 내주는 함수
y_good_pred = get_y(x_good, a1, b1, c1)

a2, b2, c2 = np.polyfit(x_bad, y_bad, 2)
y_bad_pred = get_y(x_bad, a2, b2, c2)


plt.figure(1, figsize=(8, 3))
plt.subplot(121)

plt.scatter(x_good, y_good)
plt.plot(x_good, y_good_pred, 'r')
plt.title('good_data_pred')
plt.xlabel('x')
plt.ylabel('y')

plt.subplot(122)
plt.scatter(x_bad, y_bad)
plt.plot(x_bad, y_bad_pred, 'r')
plt.title('bad_data_pred')
plt.show()

print("true parameter : {}, {}, {}".format(a_true, b_true, c_true))
print("predicted parameter good : {}, {}, {}".format(a1, b1, c1))
print("predicted parameter bad : {}, {}, {}".format(a2, b2, c2))
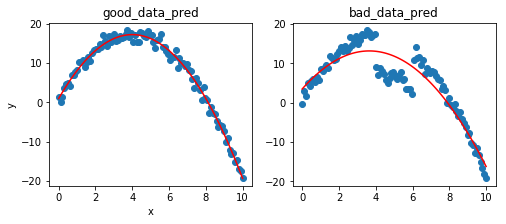
true parameter : -1, 8, 1 predicted parameter good : -1.015918507583149, 8.127778218761788, 0.9441332273227827 predicted parameter bad : -0.7282561048930103, 5.312333174153526, 3.4425031808102498
위 그림과 추정된 파라미터들을 보면 good에서는 그럴싸하지만, bad에서는 상당히 파라미터를 잘못 추축하고있는 것을 볼 수 있다. 이제 드디어 RANSAC 얘기로 넘어가보자.
RANSAC 알고리즘
가장 많은 수의 데이터로부터 지지받는 모델을 선택하는 방법. 방법은 다음과 같다.
- max_inlier = 0으로 초기화한다.
- 무작위로 세 점을 뽑는다.(parameter를 만들 때 필요한 최소 갯수의 observation)
- 2에서 뽑은 점으로 model을 만든다 = parameter setting
- 3에서 만든 모델에서 예측한 값과 일정 threshold안에 있는 inlier들의 갯수를 센다.
- 4에서 센 갯수가 max_inlier보다 크면 max_inlier를 갱신하고, model을 저장한다.
- 2~5를 N번 반복한 후 최종 저장된 model을 바노한한다.
- (optional) 최종 inlier로 뽑힌 애들로 model을 refine한다.
이제 코드로 살펴보자
def RANSAC(x, y, threshold = 0.3, N = 10):

    # (1)
    max_inlier = 0
    a, b, c = 0, 0, 0
    inlier = None  # 나중에 쉽게 하려고 inlier도 저장한다.

    # (6)
    for i in range(N):
        # (2)
        samples = np.random.uniform(0, num_samples, 3)
        samples = [int(sample) for sample in samples]
        x_sampled = x[samples]
        y_sampled = y[samples]

        # (3)
        a_tmp, b_tmp, c_tmp = np.polyfit(x_sampled, y_sampled, 2)
        y_pred = get_y(x, a_tmp, b_tmp, c_tmp)

        # (4)
        tmp_inlier = abs(y_pred - y) < threshold
        count_inlier = len(x[tmp_inlier])  # 꼼수...

        # (5)
        if count_inlier > max_inlier:
            max_inlier = count_inlier
            inlier = tmp_inlier
            a, b, c = a_tmp, b_tmp, c_tmp
    # (7)
    a, b, c = np.polyfit(x[inlier], y[inlier], 2)
    return a, b, c
알고리즘대로 만들었고… 이제 실행시켜보자
a_good, b_good, c_good = RANSAC(x_good, y_good)
a_bad, b_bad, c_bad = RANSAC(x_bad, y_bad)

y_bad_pred = get_y(x_good, a_good, b_good, c_good)
y_bad_pred = get_y(x_bad, a_bad, b_bad, c_bad)

plt.figure(1, figsize=(8, 3))
plt.subplot(121)

plt.scatter(x_good, y_good)
plt.plot(x_good, y_good_pred, 'r')
plt.title('good_data_pred')
plt.xlabel('x')
plt.ylabel('y')

plt.subplot(122)
plt.scatter(x_bad, y_bad)
plt.plot(x_bad, y_bad_pred, 'r')
plt.title('bad_data_pred')
plt.show()

print("true parameter : {}, {}, {}".format(a_true, b_true, c_true))
print("predicted parameter good : {}, {}, {}".format(a_good, b_good, c_good))
print("predicted parameter bad : {}, {}, {}".format(a_good, b_good, c_good))
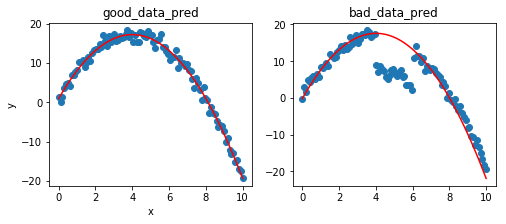
true parameter : -1, 8, 1 predicted parameter good : -0.9843167682128994, 7.790038906293564, 1.3230583655902022 predicted parameter bad : -0.9843167682128994, 7.790038906293564, 1.3230583655902022
outlier를 제거하고, 잘 나오는 것을 알 수 있다. 그러면 파라미터는 어떻게 최적화할 수 있을까?
parameter 최적화
N 최적화(inlier 비율을 알고 있을 때..)
RANSAC이 성공하려면, N번의 시도 중, 적어도 한번 inlier들에 대해서만 샘플 데이터가 뽑혀야한다. N을 키우면 그럴 확률이 커지지만 확률이 크도록 적당한 N값을 찾아서 수행시간을 줄여야함!
- $N$: 반복 횟수
- $m$: 한번에 뽑는 sample 수
- $a$: observation들 중 inlier의 비율
이라 하면 $N$번중 적어로 한번은 inlier에서만 뽑힐 확률 $p$는 다음과 같다.
샘플링하는 수가 observation 갯수보다 현저히 작다고 가정하면 $a^m$은 inlier에서 전부 뽑을 확률이다. 따라서 $1-a^m$은 inlier에서 전부 뽑히지는 않을 확률이며 이를 N번 수행했을 때이므로, 위와 같은 식이 된다.
이를 토대로 N에 대한 식으로 바꿔보면 다음과 같다. 여기에, RANSAC이 성공할 확률($p$)을 99.9로 놓고, $a$는 위의 예제에서 0.8이 되므로, N을 구해보면, 이 된다.
threshold 최적화
inlier들의 residual의 표준편차를 $\sigma$라 할 때, threshold를 $2\sigma$ 또는 $3\sigma$로 놓는 것이 좋다. 이 때, inlier들의 residual이 정규분포를 따른다고 가정하면 $2\sigma$는 97.7%, $3\sigma$는 99.9%의 inlier를 포함하게된다.
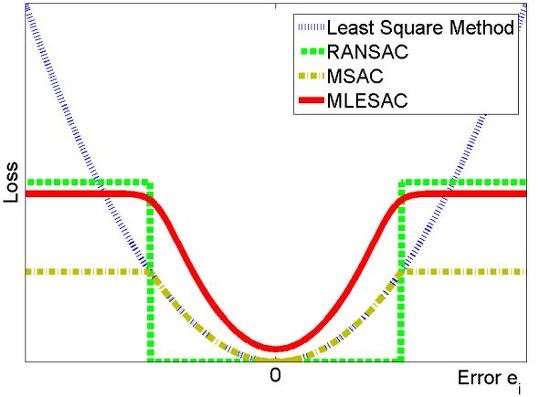
다른 robust 파라미터 추정
RANSAC처럼 데이터 중에 outlier가 있어도 추정을 잘 하는 녀석들을 robust parameter estimation algorithm이라 한다.
이 중에 RANSAC 말고도
- M-estimator
- LMedS
등이 있다.
RANSAC은 threshold 안에 들어가는 녀석들은 전부 error가 없다고 가정하는데, 이를 residual error로 일정부분 상쇄시키거나 한다. 나중에 필요하면 찾아보자!
RANSAC의 한계
- N을 아무리 늘려도 해를 못찾을 수 있다.
- outlier가 어떤 구조를 가지고있거나, 비율이 굉장히 많으면 outlier의 분포를 근사시킬 수 있다.
- parameter를 뽑기위한 sample 갯수를 최소화하는 방법은 noise를 포함한다. 따라서 인접한 sample들을 뽑으면 오차가 엄청 커지지.. 이를 위해 sample을 적당한 구간별로 나눠서 뽑는 방법이 있으면 좋겠다.