BLEU의 모든 것

|

참고문헌

wiki github

BLEU


BLEU (bilingual evaluation understudy)는 기계번역을 통해 만들어진 text의 퀄리티를 evaluate하는 algorithm이다.

퀄리티는 기계번역의 output과 사람번역의 output을 비교하여 정해진다.

BLEU는 사람이 정하는 quality와 가장 높은 연관도를 보이는 첫 metric이며, 계산량도 많지 않기때문에, 지금도 많이 쓰인다.

score는 각 문장에 대해서 reference와 비교하여 계산되고, 이를 전체 corpus에 대해 average한다.

실제로는, (전체 corpus의 n-gram 맞은 갯수) / (전체 corpus의 n-gram 갯수) 가 된다.

BLEU는 0과 1 사이의 숫자를 내며, cadidate text가 reference와 얼마나 비슷한지 유사도를 말한다.

BLEU algorithm


BLEU는 여러개의 reference 번역과 candidate를 비교하여 정확도를 계산한다.

BLEU의 algorithm을 보기 전에 간단한 unigram precision을 구하고, 이 한계점을 고쳐나가면서 설명해보자

unigram precision

unigram precision은 다음처럼 정의된다.

  • $m$: ref에서 찾은 candidate의 word의 갯수
  • $w_t$: candidate에 있는 총 word 갯수

언뜻보기에는 이정도면 번역의 퀄리티를 평가하는데 괜찮지않나? 생각이 들지만 다음 반례를 보자.

문제점 1 - 번역은 안좋은데 unigram precision이 잘 나오는 경우

Candidate the the the the the the the
Reference 1 the cat is on the mat  
Reference 2 there is a cat on the mat

7개의 단어가 모두 두 reference에 나왔기 때문에 unigram precision은 다음과 같다.

BLUE는 여기서 몇가지 변경을 할 것이다.

clip_count

  • $m_{max}$: 단어가 한 reference에서 나온 최대 갯수
    • ex> the의 경우 ref 1에 두번, ref 2에 한번 나와서 $m_{max}=2$이다.

이를 사용해서 $m$을 clipping시킬 수 있다. 그러면

상당히 그럴싸해졌다!

문제점 2 - 짧은 번역문 선호

위처럼 고쳤을 때 짧은 번역문을 선호하는 문제가 또 있다. 예를들어, the cat이 나왔다고 하면, 이 된다.

bigram을 쓴다고 하더라고 $\frac{1}{1}$으로 여전히 1이다.

brevity penalty

그래서 length를 이용한 penalty를 준다. 다음 수식을 precision에 곱해줘서 페널티를 줄 수 있다.

  • $r$: reference corpus의 length
  • $c$: candidate corpus의 length

BLEU Implementation


이제 실제 구현으로 들어가보자.

  • fetch_data
  • geometric mean
  • best_length_match
  • clip_count
  • ngram_precision
  • brevity_penalty
  • BLEU

fetch_data

data를 읽어온다.

import sys
import codecs
import os
import math
import json


def fetch_data(cand, ref):
    """ Store each reference and candidate sentences as a list """
    references = []
    if os.path.isfile(ref):
        with codecs.open(ref, 'r', 'utf-8') as reference_file:
            references = reference_file.readlines()
    else:
        for root, dirs, files in os.walk(ref):
            for f in files:
                reference_file = codecs.open(os.path.join(root, f), 'r', 'utf-8')
                references.append(reference_file.readlines())

    candidate_file = codecs.open(cand, 'r', 'utf-8')
    candidate = candidate_file.readlines()
    return candidate, references
#testCode
cand, ref = fetch_data("golden.kr.pred.djamo", "golden.kr.bpe")

candidate = cand[0]
reference = ref[0]
print('cand: %r' %candidate)
print('ref:  %r' %reference)

output:

cand: ‘범인이 현장에 무기를 두고 갔어\n’ ref: ‘공격자는 현장에 무기를 버렸다.\n’

geometric mean

기하 평균을 구한다. 이는 BLEU에서 1~4-gram에 대해 precision을 계산하는데, 이 4개의 기하 평균으로 최종 precision을 정하기 때문에 필요하다.

def geometric_mean(precisions):
    return (reduce(operator.mul, precisions)) ** (1.0 / len(precisions))

geometric_mean([0.1, 0.2, 0.3, 0.4])

output:

0.22133638394006433

best_length_match

여러 개의 reference가 존재할 때, 가장 길이가 비슷한 reference를 찾는다. 이는 brevity penalty가 너무 크기에 필요한 것으로 보인다.

def best_length_match(ref_lens, cand_len):
    '''
    candidate랑 가장 길이가 비슷한 reference를 return
    ref_lens: [3, 4, 5], cand_len : 4 => return 4
    '''
    least_diff = abs(cand_len-ref_lens[0])
    best = ref_lens[0]
    for ref_len in ref_lens:
        if abs(cand_len-ref_len) < least_diff:
            least_diff = abs(cand_l-ref_len)
            best = ref_len
    return best

clip_count

candidate의 n-gram마다 count를 세는데, 이 n-gram에 대한 reference의 max_count를 계산해서 clip한다.

마지막에 clip된 count들을 모두 더해주면 해당 sentence에 대한 count!

def clip_count(cand_d, ref_ds):
    '''
    arguments:
        cand_d: {'나는': 1, '밥을': 1, '먹었다': 1}
        ref_ds: [{'그는':1, '밥을':1, '먹었다':1},
                 {'그가': 1, '밥을':1, '먹었다':1}]
    returns:
        2 (나는 : 0, 밥을: 1, 먹었다: 1)
    '''
    count = 0
    for key, value in cand_d.items():
        key_max = 0
        for ref in ref_ds:
            if key in ref:
                key_max = max(key_max, ref[key])
        clipped_count = min(value, key_max)
        count += clipped_count
    return count

ngram_precision

위에서 본 clip_count를 사용해, 각 n-gram의 count를 구하고 이를 통해 precision을 구한다.

def ngram_precision(candidate, references, n):
    '''
    arguments:
        candidate  : ['cand1', 'cand2', ...]
        references : [['ref1_1', 'ref2_1', ...], 
                      ['ref1_2', 'ref2_2', ...], ...]
        n
    returns:
        precision for n-gram
    '''
    def _count_ngram(sentence, n):
        '''
        arguments:
            sentence: 문장 string,       ex> '나는 밥을 먹었다'
            n: n-gram의 n.               ex> 2
        returns:
            ngram_d: ngram의 dictionary. ex> {'나는 밥을': 1, '밥을 먹었다': 1}
        '''
        ngram_d = {}
        words = sentence.strip().split()  # '나는 밥을 먹었다' -> ['나는', '밥을', '먹었다']
        leng = len(words) # 3

        limits = leng - n + 1

        for i in range(limits):
            ngram = ' '.join(words[i:i+n]).lower()  # n=2일 때, '나는 밥을', '밥을 먹었다'
            if ngram in ngram_d.keys():
                ngram_d[ngram] += 1
            else:
                ngram_d[ngram] = 1
        return ngram_d
    
    
    clipped_count = 0
    count = 0
    for si in range(len(candidate)):  # si : sentence_index
        ref_counts = []   # reference의 각 word별 count ex> [{'나는 밥을':1, '밥을 먹었다':1}]

        for reference in references:
            ngram_d = _count_ngram(reference[si], n)
            ref_counts.append(ngram_d)

        # candidate
        cand_dict = _count_ngram(candidate[si], n)
        n_ngrams = 0
        for key, values in cand_dict.items():
            n_ngrams += values

        clipped_count += clip_count(cand_dict, ref_counts)  # 각 n-gram당 max-count를 재고, clipping해서 더함.
        count += n_ngrams                                   # n-gram의 갯수
    if clipped_count == 0:
        pr = 0
    else:
        pr = float(clipped_count) / count

    return pr

brevity penalty(BP)

length에 관한 penalty

  • $r$: reference corpus의 length
  • $c$: candidate corpus의 length

밑의 그림을 보면 알겠지만, reference의 length가 1.5배만 돼도 precision의 거의 40%를 페널티로 까먹는다.

import matplotlib.pyplot as plt
import numpy as np

x = np.linspace(1, 5, 200)
y = np.exp(1-x)
plt.figure(1, figsize=(5, 5))
plt.plot(x,y)
plt.title('brevity penalty')
plt.xlabel('ref_len/c_len')
plt.ylabel('BP')
plt.show()
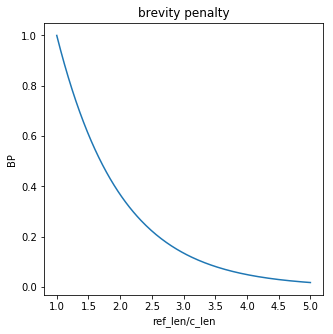
output_18_0.png

import operator
from functools import reduce

def brevity_penalty(c, r):
    if c > r:
        bp = 1
    else:
        bp = math.exp(1-(float(r)/c))
    return bp
def calculate_bp(candidate, references):
    r, c = 0, 0
    
    for si in range(len(candidate)):
        ref_lengths = []
        for reference in references:
            ref_length = len(reference[si].strip().split())
            ref_lengths.append(ref_length)

        len_candidate = len(candidate[si].strip().split())
        r += best_length_match(ref_lengths, len_candidate)
        c += len_candidate
    bp = brevity_penalty(c, r)
    return bp

BLEU

  • 1~4gram에 대해 precision을 구함.
  • 위 4개의 결과에 대해 geometric mean을 구함
  • brevity penalty를 구해서 precision에 곱해줌
def BLEU(candidate, references):
    precisions = []
    for i in range(4):
        pr = ngram_precision(candidate, references, i+1)
        precisions.append(pr)
    bp = calculate_bp(candidate, references)
    bleu = geometric_mean(precisions) * bp
    return bleu, bp, precisions


candidate, references = fetch_data("golden.kr.pred.djamo", "golden.kr.bpe")
references = [references]

bleu, bp, pr = BLEU(candidate, references)

print("BLEU : {:.2f}, {}, (BP={:.3f})".format(bleu*100, ["{0:0.1f}".format(i*100) for i in pr], bp))


cands = []
for c in candidate:
    cands.extend(c.split())
print("candidates의 word 갯수: {}".format(len(cands)))

refs = []
for r in references[0]:
    refs.extend(r.split())
print("references의 word 갯수: {}".format(len(refs)))
print("word 갯수 비율: {:.3f}".format(len(cands)/len(refs)))

# BLEU = 7.08, 28.6/11.0/4.4/1.8 (BP=1.000, ratio=1.005, hyp_len=2127, ref_len=2117)

output:

BLEU : 7.08, [‘28.6’, ‘11.0’, ‘4.4’, ‘1.8’], (BP=1.000) candidates의 word 갯수: 2127 references의 word 갯수: 2117 word 갯수 비율: 1.005

Importance sampling 예제 구현

|

Importance sampling 예제

$N(0, 1)$에서 $[2, 3]$부분만 truncate한 pdf를 만들고 그것의 평균값을 simulation하고 싶다고 가정하자.

즉 구하고 싶은 것은

$N(0, 1)$의 pdf를 $\phi$로 쓴다.

naive

  • (1)$N(0, 1)$에서 무작정 draw하고
  • (2) $\frac{\sum_i x_i \cdot \mathbb{1}(x_i \in [2, 3])}{\sum_i \mathbb{1}(x_i \in [2, 3])}$ 를 구한다.

$[2, 3]$구간에서 draw될 확률이 적기 때문에, 대부분의 sample을 버려야한다. (TODO: N(0,1), 그림 넣기)

import numpy as np

num_samples = 30000
range_ = (4, 5)

samples = np.random.normal(0, 1, num_samples)

# 쓸만한 sample index를 가져오자.
idxl = samples >= range_[0]
idxr = samples <= range_[1]
idx = idxl & idxr

samples_in_range = samples[idx]
print("{}개 중 쓸 수 있는 sample 갯수: {}개".format(num_samples, len(samples_in_range)))

result = np.sum(samples_in_range)/len(samples_in_range)
print("결과 : {}".format(result))

30000개 중 쓸 수 있는 sample 갯수: 2개
결과 : 4.350475573377283

제대로 구해보기

실제 결과와 많이 다를 것 같다.. 해보자! 그렇게 많이 다르진 않구만…

from scipy.integrate import romberg


def integrand_norm(x, s):
    return np.exp(-0.5*(x/s)**2)/(np.sqrt(2*np.pi)*s)

def integrand_normx(x, s):
    return x*np.exp(-0.5*(x/s)**2)/(np.sqrt(2*np.pi)*s)

den = romberg(integrand_norm, range_[0], range_[1], args=(1.0, ))
num = romberg(integrand_normx, range_[0], range_[1], args=(1.0, ))
print(num/den)

4.2168307809

Importance sampling

이제 importance sampling으로 구해보자!

  • 식을 다음처럼 바꾼다.

    $h(t)$는 $U[2,3]$의 pdf이며, 따라서 식 (2)의 중간에 있는 분수꼴이 importance weight가 된다.

  • $U[2, 3]$에서 draw한다. importance weight는 이며, simulated mean은 이며 버려지는 sample은 하나도 없다!
samples = np.random.uniform(range_[0], range_[1], num_samples)

print("결과: {}".format(np.sum(samples*integrand_norm(samples, 1)/den)/num_samples))


결과: 4.1905484171505805

Montecarlo integration & importance sampling

|

참고1 참고2

결론

  • pdf에서 draw가 쉽고, 적분도 쉬우면 -> 그냥 적분한다.
  • pdf에서 draw는 쉬운데 적분이 어려우면 -> MC Integration
  • pdf에서 draw도 어려우면 -> importance sampling

Law of Large Numbers(LLN 또는 큰 수의 법칙)

어떤 Random Variable에서 샘플한 $Y_1, Y_2, … , Y_n$이 존재하며, 라고 하면, 모든 $\epsilon > 0$에 대해


Monte Carlo Integration

Monte Carlo 방법은 확률적 적분의 형태이며, 큰 수의 법칙을 이용해 기대값의 근사치를 얻는데 쓰인다. 쉽게보면 잘 모르겠으면 무작정 샘플링해서 경험적으로 확률을 추출하겠다는 것이지만, 계산을 위한 트릭들이 들어간다. 다음은 그런 트릭에 관한 설명이다.

  • 여기서 $f(y)$는 uniform(a, b) pdf를 의미한다.
  • 큰 수의 법칙에 따라, 우리가 U(a,b)에서 N개의 iid sample를 갖는다면, I를 다음처럼 추정할 수 있다.

###예제 문제: $F_Y(y) = P(Y \le y)=E[I_{(-\infty, y)}(Y)]$이며 $Y \sim N(0, 1)$ 일 때 $F_Y(y)$를 추정하라.

풀이법: (1) 이렇게 식을 바꾸자!

아무래도 문제의 $E[I_{(-\infty, y)}(Y)]$는 어떤 말인지 모르겠다…

(2) 이제 N개의 샘플을 $N(0, 1)$에서 막 뽑는다!

(3) 끄읕.

내 생각

MC Integration의 실용적인 경우는 pdf는 알 수 있으나, 적분이 힘든 경우일 것 같다. 인데 바로 다음 챕터에 나오네..


Importance Sampling

동기

MC Integration은 target distribution에서 sample이 가능할 경우 굉장히 유용하다. 근데 심지어 target에서 sample이 불가능하면 어떻게 하나?

Idea

그냥 어떤 distribution을 제안하고, integral을 importance weight를 사용해 reweight한다.

그냥 $g(y)$로 나누는걸 말하는 듯 하다..

  • h 는 어떤 함수이며, f는 Y의 pdf이다.
  • f에서 sampling하기 힘들면, Importance sampling을 쓸 수 있다.
  • f에서 뽑지 말고, 다른 pdf g를 가지고 뽑자

요렇게 되면 이제 다음처럼 $g$에서 샘플링 가능하다.

주의사항 : 추정치 는 무한대가 될 수 있다. 에서 $f(y) \ne 0, g(y) = 0$인 $y$가 존재한다면… 따라서 $g$를 $f$와 비슷한 형태로 선택하되 tail이 더 긴 녀석으로 선택해야함!

예제

$N(0, 1)$에서 $[2, 3]$부분만 truncate한 pdf를 만들고 그것의 평균값을 simulation하고 싶다고 가정하자. 즉 구하고 싶은 것은

$N(0, 1)$의 pdf를 $\phi$로 쓴다.

  1. 무작정 draw: $x_i$를 $N(0, 1)$에서 계속 draw를 하고, 를 구한다. $[2, 3]$구간에서 draw될 확률이 적기 때문에, 대부분의 sample을 버려야한다.

  2. Importance sampling:

    • (1)을 다음처럼 바꾼다.


      $h(t)$는 $U[2,3]$의 pdf이며, 따라서 식 (2)의 중간에 있는 분수꼴이 importance weight가 된다.

  • $U[2, 3]$에서 draw한다. importance weight는 이며, simulated mean은 이며 버려지는 sample은 하나도 없다!

Word2vec 구현

|

What is Word2Vec?

Word2Vec은 word embedding의 한 기법이다. 쓰임새같은 것들은 다들 잘 알고있으니 넘어가도록한다.

목차는 다음과 같다.

  • Word2Vec Dataset
    • 주어, 목적어, 동사 로 이루어진 셋을 만든다. [[‘나는’, ‘밥을’, ‘먹는다’], …]
    • 이를 적절히 셔플하고, 하나로 잇는다. (데이터를 많이 만들기 싫어서)
  • Graph Build & Training
    • 실제 그래프를 만들고 트레이닝을 시켜본다. (Skip-gram model을 만든다)
  • TSNE로 embedding 결과 보기
  • 유사도 보기
    • tsne로 잘 안보이기 때문에, cos, dot product metric으로 각각 유사도를 비교해본다.
  • 나머지…

Word2Vec Dataset

간단한 toy dataset을 만들어보자!!

  • S+O+V로 된 쉬운 데이터
  • vocab

위 두가지를 만들고 decode_data라는 idx->word함수를 만든다.

import numpy as np
import tensorflow as tf
import math
import random

        # 0       1      2       3 
vocab = ['나는',   '그녀가',  '너는', '그가',
         '밥을', '콩밥을', '싸움을', '꽃을', 
         '먹었다', '했다',  '샀다', '만들었다']
dataset = [[0, 4, 8], [1, 4, 8], [2, 4, 8], [3, 4, 8],
           [0, 5, 8], [0, 5, 9], [1, 5, 8], [1, 5, 9],
           [2, 5, 8], [2, 5, 9], [3, 5, 8], [3, 5, 9],
           [0, 6, 9], [1, 6, 9], [2, 6, 9], [3, 6, 9],
           [0, 7, 10], [1, 7, 10], [2, 7, 10], [3, 7, 10], 
           [0, 6, 11], [1, 6, 11], [2, 6, 11], [3, 6, 11]]

def decode_data(data, vocab):  
    '''
    idx들의 list로 문장을 만들어주는 함수
    '''
    decoded_list = [vocab[idx] for idx in data]
    return ' '.join(decoded_list)

for data in dataset[0:5]:   # 데이터를 몇개만 찍어보자.
    print(decode_data(data, vocab))
나는 밥을 먹었다
그녀가 밥을 먹었다
너는 밥을 먹었다
그가 밥을 먹었다
나는 콩밥을 먹었다

위에서 나온 데이터로 batch를 만들어보자!

우리가 만들 모델은 Skip-gram 모델이다.

이는 하나의 input으로 여러 개의 인접 단어를 유추하는 것인데, 꼼수를 써서 input, label을 각각 하나씩 만드는 방법을 쓴다.(tensorflow 예제자체도 그렇게 구현되어있다)

데이터가 적기때문에 매번 dataset을 shuffle하도록 만들었다.

어순이 꼬이지 않게 라인단위로만 셔플을 한다.

  • 원래 문장 : 그가 밥을 먹었다
    • data : (밥을, 그가), (밥을, 먹었다)
def generate_input(dataset, num_skips):
    random.shuffle(dataset)  # 문장 단위로 셔플한다.

    # 일차원 array로 만든다. (window를 돌리기 위해!)
    flatten = []
    for list_ in dataset:
        flatten += list_

    # (나는, 그녀를 보았다.) => (i:그녀를, l:나는), (i:그녀를, l:보았다)
    data = []
    label = []
    for idx in range(num_skips, len(flatten)-num_skips):
        data.append(flatten[idx])
        data.append(flatten[idx])
        label.append([flatten[idx-1]])
        label.append([flatten[idx+1]])
    return data, label

input_, label = generate_input(dataset, 1)

확인해보자!

for i, o in zip(input_[:4], label[:4]):
    input0 = decode_data([i], vocab)
    label0 = decode_data(o, vocab)
    print("data : {}, label : {}".format(input0, label0))
data : 밥을, label : 나는
data : 밥을, label : 먹었다
data : 먹었다, label : 밥을
data : 먹었다, label : 너는

Graph build & Training

이제 그래프를 만들어볼까? 그 전에 잠깐 이론을 remind하고, 실제 구현과의 차이점을 알아보자.

loss구하는 식(이론)

  • $x$: $V x 1$의 one-hot Vector (input)
  • $W$: $N x V$의 matrix (embedding)
  • $P$: $V x N$의 matrix (projection)
  • $y$: $V x 1$의 one-hot Vector (output) 라 하면

로 o를 구한 후에, $softmax(o)$를 각 vocab의 확률로 보고 loss를 구한다.

차이점

  • Vocab이 많이 커지게 되면 nce_loss같이 sampling해서 softmax를 구하는 방식을 쓴다.
  • 실제로는 one-hot vector 대신에 idx로 embedding_lookup 함수를 통해 $W \times x$를 구한다.
vocab_size = len(vocab)
embedding_size = 5
batch_size = len(label)
num_sampled = 6  # vocab_size//2

## Graph build
embeddings = tf.Variable(tf.random_uniform([vocab_size,
                                            embedding_size],
                                           -1.0, 1.0))

nce_weights = tf.Variable(tf.truncated_normal([vocab_size,
                                               embedding_size],
                                              stddev=1.0 / math.sqrt(embedding_size)))
nce_biases = tf.Variable(tf.zeros([vocab_size]))

# Placeholders for inputs
train_inputs = tf.placeholder(tf.int32, shape=[batch_size])
train_labels = tf.placeholder(tf.int32, shape=[batch_size, 1])

embed = tf.nn.embedding_lookup(embeddings, train_inputs)

# 매번 음수 라벨링 된 셈플을 이용한 NCE loos 계산
loss = tf.reduce_mean(tf.nn.nce_loss(nce_weights,
                                     nce_biases,
                                     train_labels,
                                     embed,
                                     num_sampled,
                                     vocab_size))

# SGD optimizer 를 사용
optimizer = tf.train.GradientDescentOptimizer(learning_rate=1.0).minimize(loss)

init = tf.global_variables_initializer()
with tf.Session() as sess:
    init.run()
    for i in range(1000):
        batch_inputs, batch_labels = generate_input(dataset, 1)
        feed_dict = {train_inputs: batch_inputs, train_labels: batch_labels}
    
        _, loss_val = sess.run([optimizer, loss], feed_dict=feed_dict)
        if i % 100 == 0:
            print(loss_val)
    emb_weights = sess.run(embeddings)

np.savetxt('dataset', emb_weights, fmt='%.5e', delimiter='\t')
with open('meta', 'w') as f:
    for i in vocab:
        f.write("{}\n".format(i))
6.94404
2.38125
2.52816
2.1634
2.34068
2.05583
2.33507
2.33845
2.04755
2.25775

TSNE로 embedding 결과 보기

간단히 알아본다. 데이터가 별로 없고 해서 결과가 좋게 나오지 않는다.

from sklearn.manifold import TSNE

model = TSNE(n_components=2, random_state=0)
emb_2d = model.fit_transform(emb_weights)
emb_2d = emb_2d * 1000
import matplotlib.pyplot as plt
import pylab as Plot

from matplotlib import font_manager, rc
font_name = font_manager.FontProperties(fname="/Library/Fonts/AppleMyungjo.ttf").get_name()
rc('font', family=font_name)

%matplotlib inline

Plot.figure(figsize=(20, 20), dpi=20)
plt.scatter(emb_2d[:,0], emb_2d[:,1], 50)

for idx, word in enumerate(vocab):
    x = emb_2d[idx, 0]
    y = emb_2d[idx, 1]
    plt.text(x, y, word, fontsize=50)
plt.show()

그림은 ipynb에…

그림이 생각보다 안이쁘다… 뭐가 뭐랑 가까운지 TSNE로 봐도 제대로 안보임.

그래서 유사도를 가지고 비슷한 녀석을 뽑는 것을 만들어보자!

유사도 보기

from numpy import linalg as LA

def dot_metric(embed, query):
    return np.dot(embed, query.T)
    
def cos_metric(embed, query):
    scores = np.dot(embed, query.T)
    
    for i in range(scores.shape[0]):
        leng = LA.norm(query) * LA.norm(embed[i,:])
        scores[i] /= leng
    return scores
    
def nNeighbor(query: str, embed, vocab, metric, n=1):
    idx = vocab.index(query)
    query_vec = embed[idx,:]
    score = metric(embed, query_vec.T)
    #best_idx = np.argmax(score, n)
    idxs = (-score).argsort()
    idxs = idxs[:n]
    return decode_data(idxs, vocab)

print("-"*25+"dot product 결과" + "-"*25)
for word in vocab:
    nBest = nNeighbor(word, emb_weights, vocab, dot_metric, 4)
    print("query: %10s, neighbor: %4s" % (word, nBest))

print("-"*25+"cosine 결과" + "-"*25)
for word in vocab:
    nBest = nNeighbor(word, emb_weights, vocab, cos_metric, 4)
    print("query: %10s, neighbor: %4s" % (word, nBest))

-------------------------dot product 결과-------------------------
query:         나는, neighbor: 너는 그가 나는 그녀가
query:        그녀가, neighbor: 너는 그가 나는 그녀가
query:         너는, neighbor: 너는 그가 나는 그녀가
query:         그가, neighbor: 너는 그가 나는 그녀가
query:         밥을, neighbor: 밥을 콩밥을 샀다 했다
query:        콩밥을, neighbor: 콩밥을 밥을 만들었다 싸움을
query:        싸움을, neighbor: 싸움을 콩밥을 먹었다 만들었다
query:         꽃을, neighbor: 꽃을 먹었다 했다 만들었다
query:        먹었다, neighbor: 먹었다 샀다 했다 싸움을
query:         했다, neighbor: 했다 만들었다 먹었다 밥을
query:         샀다, neighbor: 샀다 먹었다 밥을 콩밥을
query:       만들었다, neighbor: 만들었다 했다 콩밥을 밥을
-------------------------cosine 결과-------------------------
query:         나는, neighbor: 나는 너는 그녀가 그가
query:        그녀가, neighbor: 그녀가 나는 그가 너는
query:         너는, neighbor: 너는 나는 그녀가 그가
query:         그가, neighbor: 그가 그녀가 나는 너는
query:         밥을, neighbor: 밥을 콩밥을 했다 샀다
query:        콩밥을, neighbor: 콩밥을 밥을 싸움을 만들었다
query:        싸움을, neighbor: 싸움을 콩밥을 꽃을 먹었다
query:         꽃을, neighbor: 꽃을 했다 만들었다 먹었다
query:        먹었다, neighbor: 먹었다 했다 샀다 꽃을
query:         했다, neighbor: 했다 만들었다 밥을 먹었다
query:         샀다, neighbor: 샀다 먹었다 밥을 콩밥을
query:       만들었다, neighbor: 만들었다 했다 콩밥을 꽃을

OSX에서 install된 폰트들 찾기

다음 명령어로 확인할 수 있다.

font_manager.OSXInstalledFonts()
['/Library/Fonts/Andale Mono.ttf',
  ...
 '/System/Library/Fonts/ZapfDingbats.ttf']

Word2vec 이론

|

word2vec에는 두가지 방식의 네트워크 모델이 주어진다.

  • CBOW
    • 여러 단어를 보고 한단어 맞추기
  • Skip-gram
    • 한 단어보고 연관된 여러단어 맞추기

CBOW

one-word context

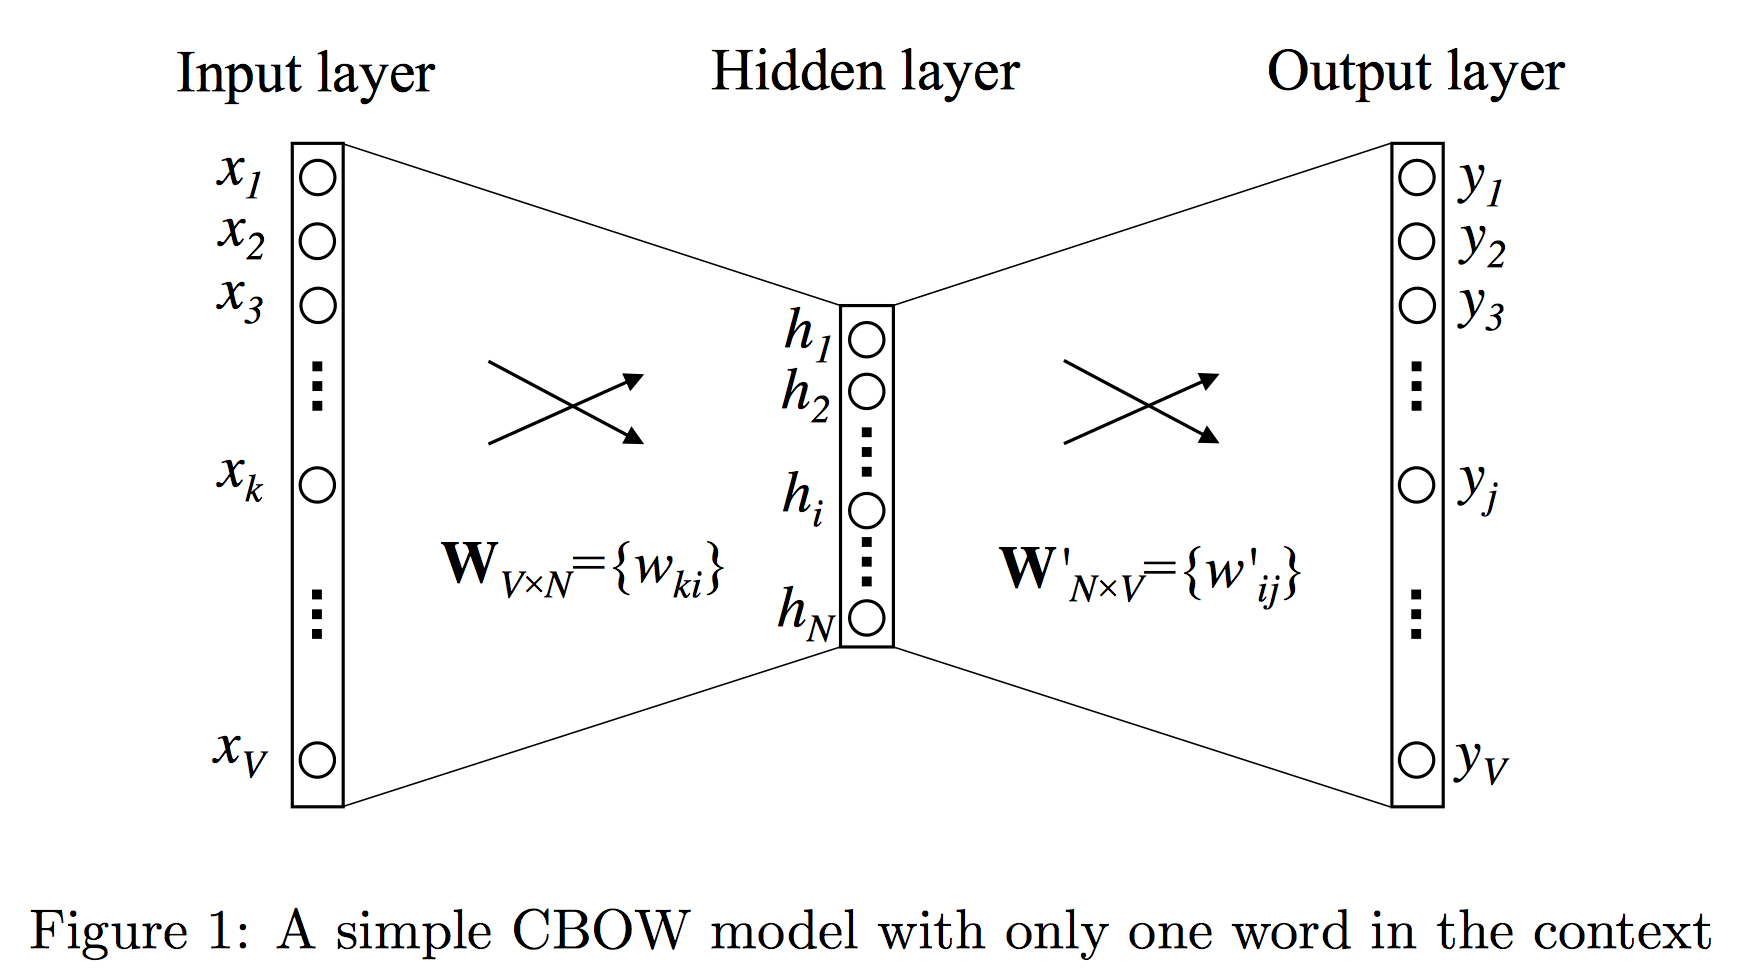
bigram처럼 한번에 한 단어만 보고 다음 단어를 유추한다.

1-CBOW

이 그림은 왼손잡이용!

Input -> Hidden layer

  • $\mathbb{x}$
    • $V\times 1$인 input vector(one-hot)

이제, Hidden layer로 보내기 위해 matrix $\mathbb{W}$를 거친다.(where size: $N \times V$)

그러면 $\mathbb{h} = \mathbb{W}\mathbb{x}$는

  • hidden layer의 output이며
  • $k$번째 word에 대한 $\mathbb{h}$는 $\mathbb{W}_{(:,k)}$이다.
  • word $w_I$에 대한 vector representation이라 볼 수 있다.
    • $\mathbb{v}_{w_I}$로 쓴다.

Hidden -> Output layer

를 size 인 hidden->output layer로 보내는 녀석이라 정의하자.

이제 의 $j$-th row라 정의하고, j번째 word의 score를 $u_j$라 정의하면 가 된다.

마지막으로 Probability를 구하기 위해 $softmax(u_j)$를 $y_j$로 정의한다.

이제

  • $\mathbb{v}_w$: input vector
    • $W$의 column
  • $\mathbb{v’}_w$: output vector
    • $W’$의 row

라고 부른다.

Backpropagation

Output -> Hidden layer

$o$가 true word의 index일 때 업데이트는 다음처럼 이루어진다.

해석:

  • j = o인 경우
    • $\mathbb{v’}_{w_j}$를 $\mathbb{h}$에 가깝게 update한다. 그런데 $\mathbb{h}$는 input vector repr.이니까 input vector에 가깝게 간다고 볼 수 있다.
  • j != o인 경우
    • $\mathbb{v’}_{w_j}$를 $\mathbb{h}$에서 멀어지도록 update한다.

label이 o일 때 backpropagation 계산…


니까

Hidden -> Input layer

해석:

  • input vector와 관련있는 column 하나만…
    • input vector는 output vector에 가까워지며, 나머지 vector에 대해서 error term만큼 멀어진다.
  • otherwise
    • 그대로.

label이 o일 때 backpropagation 계산… (계속)

이므로

$EH$ : 모든 output vector의 summation인데, 단어의 prediction error로 weighted된 것!
-> 맞는 output vector는 +, 아닌 output vector는 -를 해서 더해준 녀석.
$h_i = \sum w_{i,k} \cdot x_k$이므로


Multi-word context

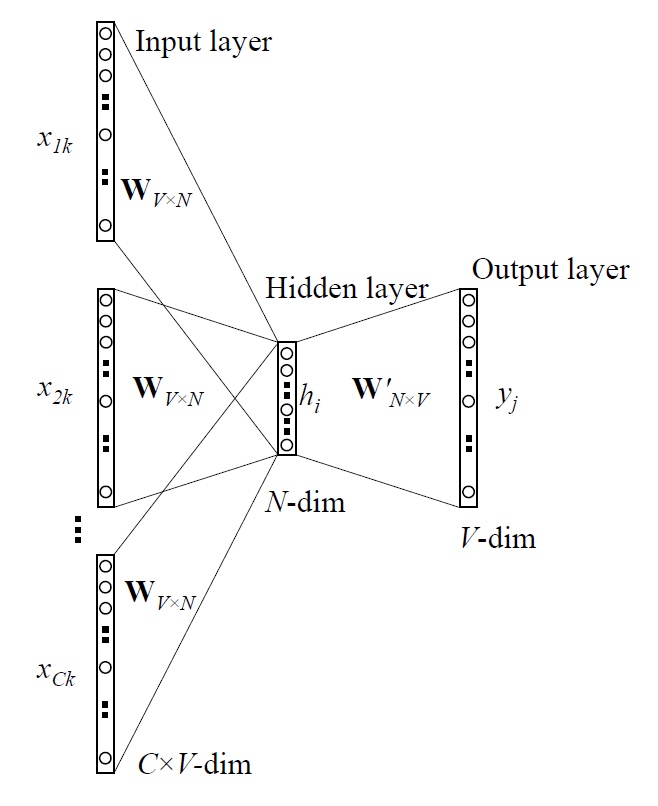
이제는 여러 단어를 보는 CBOW 모델을 살펴보자. 아까처럼 바로 input-vector를 hidden으로 가져오는 것이 아니라, 평균을 내서 쓴다. IMAGE 요렇게 만들면 Hidden까지의 Backpropagation은 똑같다.
의미는 역시 제대로 예측된 녀석은 평균 input vector에 가까워지고, 아닌 녀석은 멀어지게 한다는 것!

Hidden -> Input layer

이것도 똑같이 업데이트하는데, $\frac{1}{C}$로 나눠서 가까워지고 멀어진다는 것!


Skip-gram Model

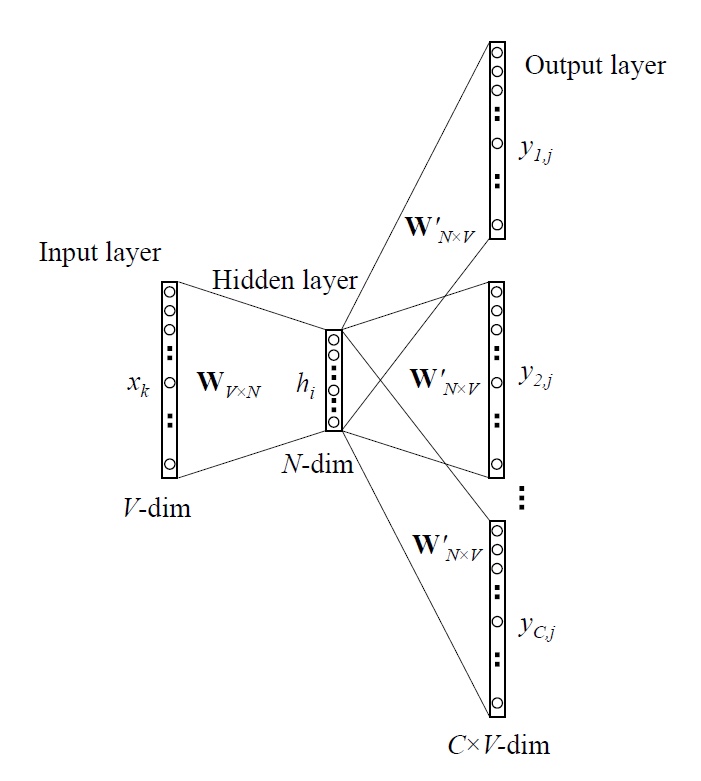
input 1개로 여러개의 단어를 유추한다. 여기서는 softmax가 N개가 나오겠지? IMAGE

Backpropagation

Output -> Hidden layer

로 정의하면

Hidden -> Input layer

로 정의하면 CBOW의 식과 같아진다.


계산 복잡도 줄이기!

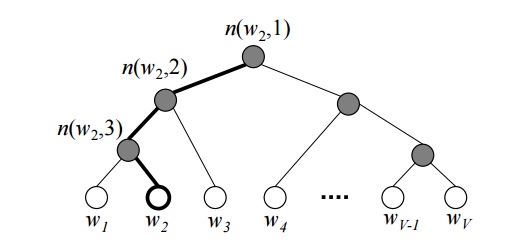
Hierarchical Softmax

IMAGE

  • n(w,j) : 단어 w의 j번째 unit
  • ch(n) : n의 왼쪽 자식노드
  • $v’_{n(w,j)}$ : inner unit n(w,j)의 output vector
  • $W’$안쓴다.
    • 대신 V-1개의 inner-node들이 output vector $v’_{n(w,j)}$를 가진다.
  • $\mathbb{[}x\mathbb{]}$ : x가 참이면 1, 거짓이면 -1

위의 예제에서 root node는 단 두개의 vector repr.만 가지면 되며, 업데이트할 때에도 자기 vector repr.만 신경쓰는 듯!

Negative Sampling

motivation

softmax를 전체에 대해서 해버리니 너무 계산량이 많다. 여기서 sample을 뽑아서 얘네만 update하는건 어때?

방법

일단 ground truth는 당연히 들어가야하고(positive sampling), negative sample들을 몇 개 뽑아서 같이 update해야한다.(그래서 이름이 이렇게…)

  • $P_n(w)$ :noise distribution
    • sample을 draw할 distribution
    • 임의로 고를 수 있다.

      unigram distribution의 3/4승 한게 제일 좋다더라..

loss를 요렇게 계산한게 좋다더라.

  • $\dot{W}_{neg}$ : negative sampling한 녀석의 set